

A collaboration between Argonne National Laboratory and the Electronic Visualization Laboratory at the University of Illinois Chicago
Please Note: Special screening during SC26 on Wednesday, November 18, 2026, 7:30-8:00 p.m.
Where Data Becomes Light is a digital light projection and immersive visual experience that celebrates the beauty of science through contemporary visualization. On view nightly, Thursday through Sunday, at THE MART starting September 10, the large-scale imagery transforms the 2.5-acre building façade into a luminous canvas, where sweeping animations and vivid imagery inspire curiosity and wonder, and invite audiences to witness the elegance and complexity of the natural world through the lens of modern scientific computing.
Scientific discovery often begins with numbers, signals, and equations, but its deepest insights emerge when those patterns become visible. Scientific visualization transforms complex data into images that reveal structure, motion, and meaning, allowing us to see phenomena that would otherwise remain hidden. In these images, turbulence becomes choreography, molecular interactions resemble intricate architecture, and the evolution of galaxies unfolds like a vast celestial landscape.
The Collaboration
For decades, researchers have used visualization to transform massive datasets into images that reveal patterns hidden in raw numbers. As high-performance computing has grown in prominence to address the biggest challenges in science and engineering, Argonne National Laboratory has played a key role in this evolution, operating world-class supercomputers and producing visualizations that illuminate everything from the structure of materials and the behavior of turbulent flows to the formation of galaxies and the dynamics of climate systems.
At the same time, the Electronic Visualization Laboratory at the University of Illinois Chicago helped define the modern field of visualization. EVL researchers’ work contributed to the landmark National Science Foundation report on scientific visualization, which helped establish visualization as a critical component of scientific discovery. EVL’s innovations in immersive visualization environments and collaborative visual computing have expanded the ways scientists and the public experience complex data.
About the Commission
This project brings together scientists, visualization researchers, and artists to create a cinematic journey through data and discovery. The experience invites viewers to encounter science not only as knowledge but also as a shared visual experience, revealing the hidden structures and patterns that shape our universe. Across the city's nighttime canvas, data becomes light, discovery becomes motion, and scientific exploration becomes a shared visual experience.
Project Leads
- Michael E. Papka, Argonne National Laboratory and University of Illinois Chicago
- Daria Tsoupikova, University of Illinois Chicago
Project Team
- Zainab Ahmed, University of Illinois Chicago
- Beth Cerny, Argonne National Laboratory
- Joseph Insley, Argonne National Laboratory
- Farah Kamleh, University of Illinois Chicago
- Krystofer Kim, Independent Contractor
- Janet Knowles, Argonne National Laboratory
- Victor Mateevitsi, Argonne National Laboratory and University of Illinois Chicago
- Julie Parente, Argonne National Laboratory
- Silvio Rizzi, Argonne National Laboratory and University of Illinois Chicago
- Laura Wolf, Argonne National Laboratory
Sound Design
- Silvio Rizzi, Argonne National Laboratory and University of Illinois Chicago
Acknowledgement
This installation was made possible through the efforts of the team at The Mart, including Paul Heinen, Chief Operating Officer; Lisa Simonian, Vice President – Head of Tradeshows; Cynthia Noble, Director of Art on the Mart, who led the creative direction, and Renata Martell, Marketing Coordinator, who coordinated promotion and outreach; and Michael Pritchett, Vice President of IT, and Anthony Podraza, IT Manager, who provided technical support. Dominic Glimco and Maison Riley of Pure Dezign operated the projection systems that brought the work to life on the building's facade, with Pure Dezign handling the projection mapping.
Featured Visualizations in the Art Projection
 |
Credits: John Hart, Daniel Sandin, Electronic Visualization Laboratory, University of Illinois Chicago; Lou Kauffman, Mathematics, Statistics, and Computer Science, University of Illinois Chicago Caption: In 1989, John Hart, a UIC computer science graduate student, hit upon the idea of using a distance estimation technique witch made computation more efficient and provided a basis for determining surface orientation of three and higher dimensional fractal objects. This video documents a very early version of the visualization research which led to the project Quaternion Julia Sets in Virtual Reality that premiered at Supercomputing '95. |
 |
Credits: George Francis, Chris Hartman, Mathematics, University of Illinois Urbana-Champaign; Louis Kauffman, Mathematics, Statistics, and Computer Science, University of Illinois Chicago; Daniel Sandin, John Hart, Dana Plepys, Sumit Das, Electronic Visualization Laboratory, University of Illinois Chicago Caption: This video illustrates a topological trick with mathematical strings to illustrate the elusive property of an electron. In quantum mechanics all particles are connected to each other and to every observer in the universe. A quantum mechanical system involving electrons is brought back into exact coincidence with itself after it is rotated by 720 degrees and not 360 degrees. |
 |
Credits: Stephan Meyers, (Art)n Laboratory Caption: This is an example of early computer graphics animation developed by students at the Electronic Visualization Laboratory. This animation was created by Stephan Meyers. |
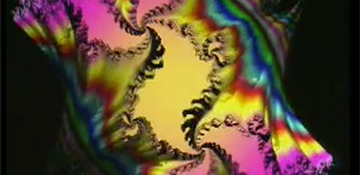 |
Credits: Daniel J. Sandin, John Hart, Tom DeFanti, Electronic Visualization Laboratory, University of Illinois Chicago; Lou Kauffman, Mathematics, Statistics, and Computer Science, University of Illinois Chicago Caption: Computer animation of a 2D Julia Set (fractal) created by Dan Sandin in 1990. |
 |
Credits: Daniel J. Sandin, Shalini Venkataraman, John Hart, Tom DeFanti, Electronic Visualization Laboratory, University of Illinois Chicago; Louis Kauffman, Yumei Dang, Mathematics, Statistics, and Computer Science, University of Illinois Chicago; Stephan Vankov, Interdisciplinary Computing in the Arts, University of California, San Diego Title: Computer animation of a 4D Julia Set created by Dan Sandin in 2005. |
 |
Credits: John C. Hart, Electronic Visualization Laboratory, University of Illinois Chicago, and National Center for Supercomputing Applications, University of Illinois Urbana-Champaign Caption: This is an example of early mathematical visualization developed by John C. Hart while a PhD graduate student at the Electronic Visualization Laboratory. |
 |
Credits: Aditya Koneru, Mechanical Engineering, University of Illinois at Chicago and Center for Nanoscale Materials, Argonne National Laboratory; Subramanian Sankaranarayanan, Center for Nanoscale Materials, Argonne National Laboratory and Mechanical and Industrial Engineering, University of Illinois Chicago; Argonne Leadership Computing Facility Visualization Team, Argonne National Laboratory Caption: Sodalite cages are structural units found in the mineral sodalite and related materials like zeolites. Machine learning models are used to understand growth processes and atomic-level dynamical transitions in silica. Naturally occurring and synthetic zeolites have numerous applications, including water purification, catalysis in oil refining, and as components in detergents. |
 |
Credits: Mathew J. Cerukara, Badri Narayanan, Henry Chan, Center for Nanoscale Materials, Argonne National Laboratory; Subramanian Sankaranarayanan, Center for Nanoscale Materials, Argonne National Laboratory and Mechanical and Industrial Engineering, University of Illinois Chicago; Argonne Leadership Computing Facility Visualization Team, Argonne National Laboratory Caption: Massively parallel molecular dynamics simulations carried out on the Argonne Leadership Computing Facility’s supercomputer, Mira, are providing insight into materials that are vital to the improved design and functionality of the next generation of electronic devices. Silicene has a number of desirable properties, which could make it ideal for use in such devices. These simulations identify the elementary steps involved in the formation and evolution of monolayers of silicene on an iridium substrate. |
 |
Credits: Anastassia Alexandrova, Chemistry and Biochemistry, University of California, Los Angeles; Argonne Leadership Computing Facility Visualization Team, Argonne National Laboratory Caption: This image shows platinum nanoclusters (red are hydrogen and yellow are platinum atoms) on an aluminum oxide surface (light and dark blue atoms). These platinum nanoclusters, under a hydrogen environment, play a crucial role in many heterogeneous catalysis applications. Using advanced computer simulations, the researchers found that instead of staying in one fixed form, the platinum "shape-shifts" into many different structures depending on the environment. Understanding this flexibility is crucial for designing more efficient catalysts for clean energy technologies, like fuel cells, which rely on platinum to drive chemical reactions. |
 |
Credits: T. Krogel, Kevin Gasperich, Physical Sciences, Oak Ridge National Laboratory; Paul R. C. Kent, Center for Predictive Simulation of Functional Materials, Oak Ridge National Laboratory; Hyeondeok Shin, Anouar Benali, Computational Science, Argonne National Laboratory; Olle Heinonen, Physical Sciences and Engineering, Argonne National Laboratory; Argonne Leadership Computing Facility Visualization Team, Argonne National Laboratory Caption: Optimized geometry of GeSe monolayer. Using a newly developed structural optimization algorithm within Quantum Monte Carlo, the GeSe structure is fully optimized (colored structure) from the initial structure (clear structure). |
 |
Credits: Sanket Deshmukh, Center for Nanoscale Materials, Argonne National Laboratory; Subramanian Sankaranarayanan, Center for Nanoscale Materials, Argonne National Laboratory and Department of Mechanical and Industrial Engineering, University of Illinois Chicago; ALCF Visualization Team, Argonne National Laboratory Caption: Large scale molecular dynamics explain the origin of macroscale superlubricity. Graphene patches scroll over nanodiamonds reducing the contact area leading to the friction-less state. |
 |
Credits: Walid Hindo, North Chicago Veterans Administration Medical Center; Sumit Das, Electronic Visualization Laboratory, University of Illinois Chicago Caption: The video, created by Sumit Das in collaboration with Walid Hindo from the North Chicago Veterans Administration Medical Center, shows a medical visualization of a human bronchi (lungs) and explains the medical and potentially therapeutic benefits to the use of this technology for medical simulation and early detection. |
 |
Credits: Erik De De Schutter, James M. Bower, California Institute of Technology; Jason Leigh, Tom DeFanti, Sumit Das, Electronic Visualization Laboratory, University of Illinois Chicago; James Inglehart, Department of Computer Science, University of Illinois Chicago Caption: The video shows a medical visualization of a Purkinje Cell (of the brain) and explains the medical and potentially therapeutic benefits to the use of this technology for medical simulation. |
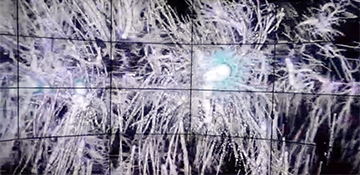 |
Credits: Peter Hanula, Kamil Piekutowski, Kyle Almryde, Department of Computer Science, University of Illinois Chicago; G. Elisabeta Marai, Arthur Nishimoto, Carlos Uribe, Electronic Visualization Laboratory, University of Illinois Chicago; Julieta Aguilera, Adler Planetarium Caption: Visualization of large-scale, n-body cosmological simulations of Dark matter Particle and Halo data from the Dark Sky Simulation project. These halos evolve over time, and are organized in merger trees; the trees indicate the parentage of a halo at a given timestep. |
 |
Credits: Jifu Tan, Michael Hood, Department of Mechanical Engineering, Northern Illinois University; ALCF Visualization Team, Argonne National Laboratory Caption: High-performance computational models enable scientists and engineers to study the complex transport behavior of circulating tumor cells in blood cell suspensions. These models provide better designs for microfluidic devices, such as micropost sizes, shapes, and separation distances, to isolate circulating tumor cells from patient blood samples. |
 |
Credits: Aristotle Martin, William Ladd, Amanda Randles, Biomedical Engineering, Duke University; Silvio Rizzi, Victor Mateevitsi, Joseph Insley, Geng Liu, Argonne Leadership Computing Facility Visualization Team, Argonne National Laboratory; Saumil Patel, Mathematics and Computer Science, Argonne National Laboratory; Seyong Lee, Jeffrey Vetter, Computer Science and Mathematics, Oak Ridge National Laboratory; John Gounley, Computational Sciences and Engineering Division, Oak Ridge National Laboratory Caption: The trajectory of a circulating cancer cell was simulated in a human arterial network using the 3D fluid-structure-interaction code, HARVEY from the Randles Lab at Duke University. The red blood cells are colored by forces on the cells, the streamlines show the flow paths, and the white spherical cell represents the cancer cell. |
 |
Credits: Umesh Paliath, GE Global Research; Argonne Leadership Computing Facility Visualization Team, Argonne National Laboratory Caption: This visualization shows high-fidelity simulations of noise generated by wind turbine airfoils and jet exhaust nozzles. Large Eddy Simulation and computational aeroacoustics reveal how turbulent airflow creates and propagates sound, helping characterize difficult-to-measure acoustic sources and improve predictive models for designing quieter, more efficient wind turbines and jet engines overall. |
 |
Credits: Alexei Khokhlov, Astronomy and Astrophysics, University of Chicago; Joanna Austin, Andrew Knisely, Aerospace, Aeronautical and Astronautical Engineering, University of Illinois Urbana-Champaign; ALCF Visualization Team, Argonne National Laboratory Caption: Weak ignition behind a reflected shock in 2H2+O2 mixture at initially atmospheric pressure. The figure shows a two-dimensional distribution of density in the middle of a shock tube with a square cross-section of 5cm x 5cm. The end wall of the tube is on the right. The reflected bifurcated shock is on the left and is moving to the left. Weak ignition took place near the end wall approximately 60 microseconds after the shock reflection. The transition of the flame to a detonation happened several microseconds later. Expanding detonation wave is visible on the right. Computations were performed on Blue Gene/Q, Mira at the ALCF. |
 |
Credits: Julien Dominski, Choongseock “CS” Chang, Princeton Plasma Physics Laboratory; ALCF Visualization Team, Argonne National Laboratory Caption: Simulation of tungsten transport in the ASDEX-U tokamak plasma reveals critical insights for fusion reactor design. Tungsten, used for its heat resistance, ionizes during operation and can penetrate the core, radiating energy and reducing efficiency. These simulations explore the interaction of tungsten ions with rotation and light impurities like boron and helium in the complex edge region near the wall. The study highlights the role of binary collisions and asymmetries in tungsten penetration. Confidence in the model is bolstered by recent validation on a separate physics problem. |
 |
Credits: Abbas Moradi Bilondi, Parisa Mirbod, Mechanical and Industrial Engineering, University of Illinois Chicago; Hal Brynteson, Computer Science, University of Illinois Chicago; Michael E. Papka, Argonne National Laboratory and Department of Computer Science, University of Illinois Chicago; Luca Brandt, Norwegian University of Science and Technology; Nicolo Scapin, Mechanical and Aerospace Engineering, Princeton University Caption: Introducing dispersed droplets into turbulent Rayleigh-Benard convection enhances heat transfer by increasing droplet coalescence, local droplet distribution variations, and thermal plume interactions. Up to 50% droplet concentration yields a maximum 10% heat transfer improvement, with significant effects on diffusion flux and convection near walls, indicating potential for optimizing heat transfer in multiphase flows. |
 |
Credits: Akintomide Afolayan Akinsanola, Earth and Environmental Sciences, University of Illinois Chicago and Environmental Science, Argonne National Laboratory; Chunyong Jung, Jiali Wang, Gökhan Sever, Veerabhadra Rao, Environmental Science, Argonne National Laboratory; Argonne Leadership Computing Facility Visualization Team, Argonne National Laboratory Caption: Using very high spatial-resolution regional-scale climate models, researchers are exploring the physics underlying the formation and evolution of extremes in precipitation and temperature in the current and future climates under various greenhouse gas emission scenarios. |
 |
Credits: Akintomide Afolayan Akinsanola, Earth and Environmental Sciences, University of Illinois Chicago and Environmental Science, Argonne National Laboratory; Chunyong Jung, Jiali Wang, Gökhan Sever, Veerabhadra Rao, Environmental Science, Argonne National Laboratory; Argonne Leadership Computing Facility Visualization Team, Argonne National Laboratory Caption: Simulations performed on Polaris at Argonne using WRF models at cloud resolving (1 km) spatial resolution for the month of September 2017. These simulations covered the entire North American continent and include approximately 2 billion grid cells. The picture shows cloud cover from these simulations during this particularly active hurricane period over the Western Atlantic, including Hurricane Maria. |
 |
Credits: Robert Harkness, Michael L. Norman, Rick Wagner, San Diego Supercomputer Center, University of California, San Diego; Daniel R. Reynolds, Mathematics, Southern Methodist University; ALCF Visualization Team, Argonne National Laboratory Caption: This visualization reveals how light from the earliest galaxies transformed gas in the young universe. By comparing radiative and non-radiative simulations with identical starting conditions, it highlights differences in ionization. Yellow and red mark expanding ionized regions, blue shows concentrated gas, and purple traces the advancing boundary of cosmic ionization. |
 |
Credits: Adam Burrows, Astrophysical Sciences, Princeton University; Tianshu Wang, University of California, Berkeley; David Vartanyan, University of Idaho; ALCF Visualization Team, Argonne National Laboratory Caption: These stills, each examples of supernova explosions launched in the belly of a massive star as it dies in the explosion. The blue veil depicts the shock wave coursing out into the doomed star. The interior surface traces the blasting ejected matter, painted by red for matter that is being ejected and painted blue for matter still acceting onto the newly-created neutron star, destined likely to become a radio pulsar. |
 |
Credits: Adam Burrows, Astrophysical Sciences, Princeton University; Tianshu Wang, University of California, Berkeley; David Vartanyan, University of Idaho; ALCF Visualization Team, Argonne National Laboratory Caption: The shards of matter ejected in the death of a massive star that has just exploded as a supernova. The red blobs are the isotope nickel-56, destined to decay into iron, the blue bubbles are oxygen created during the more quiescent evolution of the star, and the gold fingers are hydrogen and helium lifted off and shredded during the explosion. |
 |
Credits: Yan-Fei Jian, Center for Computational Astrophysics, Flatiron Institute; Lars Bildsten, Kavli Institute for Theoretical Physics, University of California, Santa Barbara; Argonne Leadership Computing Facility Visualization Team, Argonne National Laboratory Caption: This image shows the envelope structures of an 80 solar mass star with initial rotating velocity of 50% of the critical value. Isocontours show the gas density while streamlines represent the flow velocity, and are colored according to the radiation energy density. Convection develops in the envelope and causes the envelope to be turbulent. Radiation driven outflow develops due to the helium opacity peak and rotation enhances the outflow rate. The outflow also carries away a significant fraction of the initial angular momentum in the convective region. |
 |
Credits: Adam Burrows, Astrophysical Sciences, Princeton University; Tianshu Wang, University of California, Berkeley; David Vartanyan, University of Idaho; ALCF Visualization Team, Argonne National Laboratory Caption: The swirling vortex of the equatorial region of the core (blue) of a collapsed massive star in the process of exploding as a supernova. The jets (red) launched along the poles are powering the supernova. Preceded by the creation of a dense neutron star, this simulation eventually witnessed the birth of a spinning black hole, The trails are representative trajectories of matter rotating around the dense core and depict disk matter that will soon be eaten by the black hole. |
 |
Credits: Lizhong Zhang, Christopher White, Center for Computational Astrophysics, Flatiron Institute; Kyle Felker, AthenaK Development Team, ALCF Visualization Team, Argonne National Laboratory Caption: Global view of super-Eddington accretion onto a spinning stellar-mass black hole. The black hole is surrounded by a geometrically thick, dense accretion disk of hot plasma, mostly supported by radiation pressure against gravity. This puffy disk forms a spiraling structure as it falls inward and emits X-ray radiation. Relativistic jets, driven by the interaction between electromagnetic fields and black hole spin, are launched from the inner polar region and can propagate over extreme distances. The system resembles ultraluminous X-ray sources (ULXs), which are thought to be powered by such super-Eddington disks. |
 |
Credits: The Hardware/Hybrid Accelerated Cosmology Code (HACC) Collaboration, Argonne National Laboratory; Argonne Leadership Computing Facility Visualization Team, Argonne National Laboratory Caption: This image shows the temperature of gas across a portion of the simulated universe, tracing the cosmic web of filaments and clumps formed as gas flows, collides, and reacts to its surroundings. It comes from Frontier-E, the largest cosmological simulation of its kind, run on the Frontier supercomputer at Oak Ridge National Laboratory in collaboration with Argonne National Laboratory. It's the first simulation to model four trillion particles of both gas and dark matter together at this scale, capturing the universe's structure with unprecedented realism. |
 |
Credits: The Hardware/Hybrid Accelerated Cosmology Code (HACC) Collaboration, Argonne National Laboratory; Argonne Leadership Computing Facility Visualization Team, Argonne National Laboratory Caption: The animation follows dark matter particles as they move through space and gradually pull together under the force of gravity. Over time, they gather into filaments and dense clumps, building up the largest structure in the simulation: a giant dark matter halo. This growing halo marks where a massive galaxy cluster would eventually form. The visualization comes from "The Last Journey," a massive cosmological simulation run on the Mira supercomputer at Argonne National Laboratory. |
 |
Credits: Yan-Fei Jian, Matteo Cantiello, Center for Computational Astrophysics, Flatiron Institute; Lars Bildsten, Kavli Institute for Theoretical Physics, University of California, Santa Barbara; Omer Blaes, Physics, University of California, Santa Barbara; Eliot Quataert, Astronomy, University of California, Berkeley; James Stone, Astrophysical Sciences, Princeton University; Argonne Leadership Computing Facility Visualization Team, Argonne National Laboratory Caption: Massive stars play an important role in many astrophysical environments such as star formation and the structure of the interstellar medium in galaxies. However, the structures and mass loss of massive stars, which are crucial to understand the evolution and fate of massive stars, are still mysteries. Global radiation hydrodynamic simulations of an 80 solar mass star envelope were performed on the Argonne Leadership Computing Facility’s supercomputer, Mira, to find the answers. Here we present visualizations of the data produced in these simulations, which show the important role that helium opacity plays in outbursts from massive stars. |